Dashboards
A dashboard provides an at-a-glance view of key data and statistics related to a particular solution. This data may encompass things like order data, the total number of visitors, or query counts from systems such as a Product Information Management (PIM) system or user management. The information is displayed on a workspace through interactive components known as widgets.
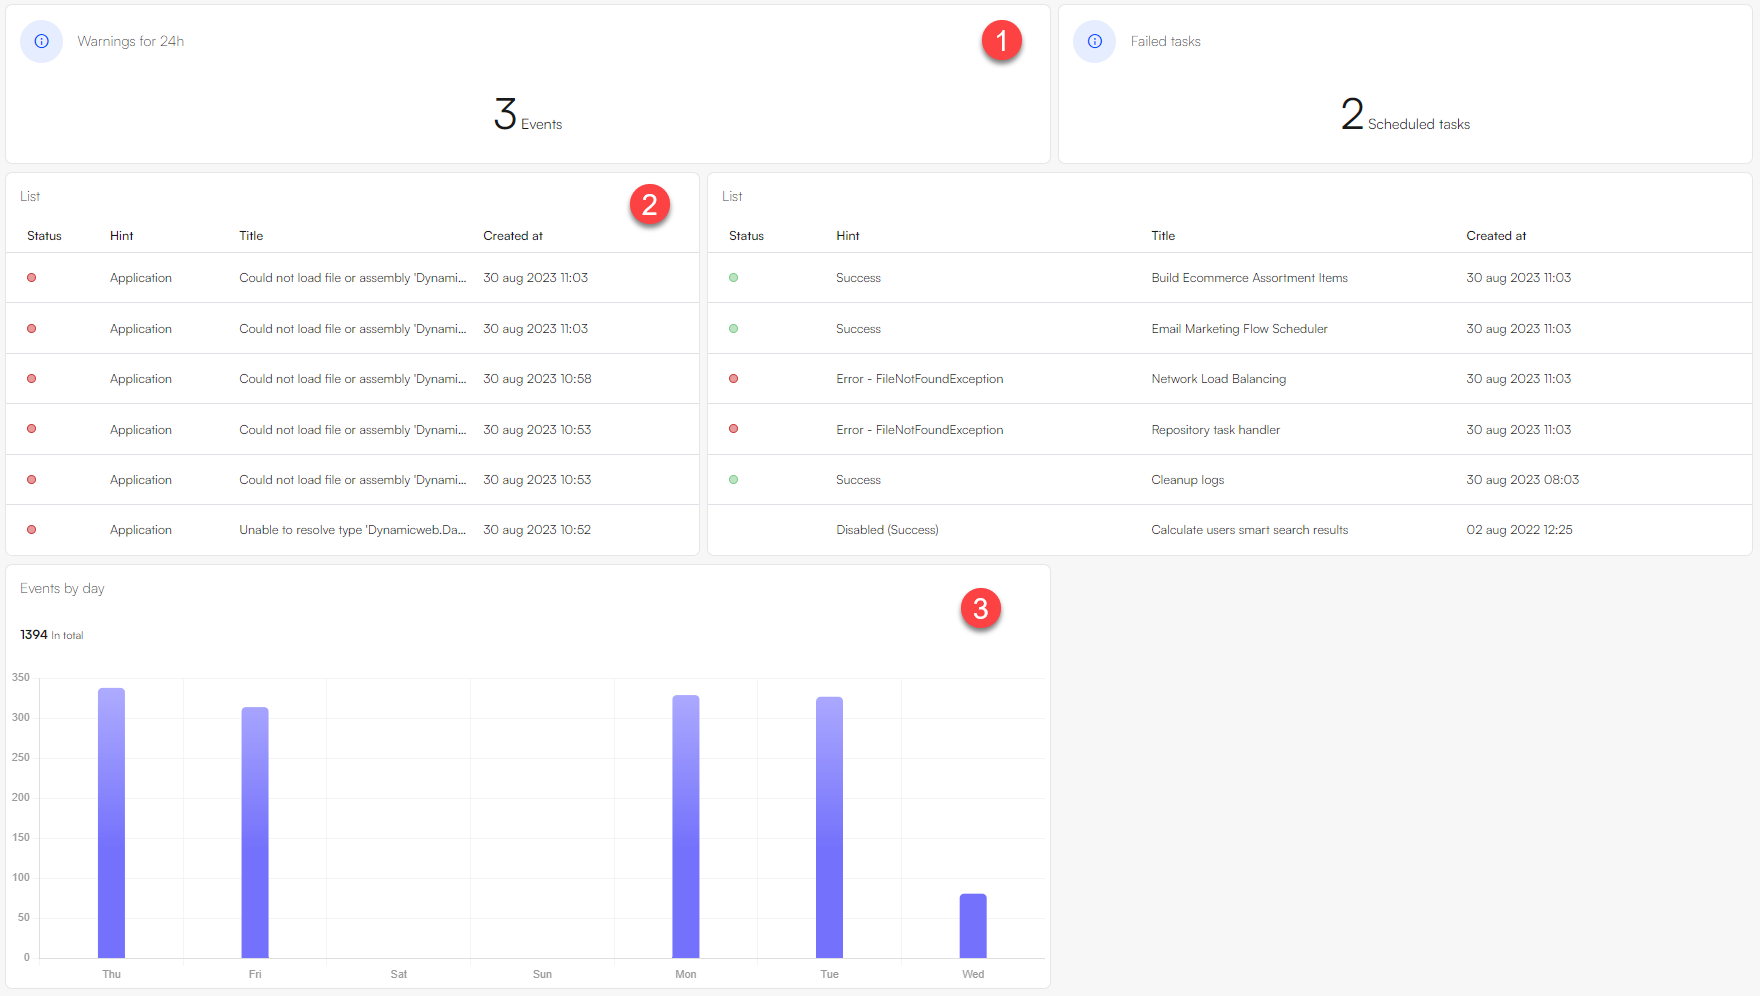
The functionality of a dashboard is manyfolded and useful for creating an instant overview. They can be customized to suit a specific work area or personal preference. You can e.g. use the dashboard with the counter widgets to show the number of warnings from events (1). Make use of the list widgets to render key data in a list format (2), or use graph widgets for a more visual formatting of your data (3).
The following DynamicWeb areas contain customizable dashboards:
- Ecommerce
- Marketing
- Insights
- Monitoring
- Products
Each of these dashboards contain a default workspace with a preconfigured widget layout. If the layout is changed, the changes are saved to the user profile to ensure a consistent experience across sessions, allowing the dashboard to be tailored to the needs of that particular user.
Creating custom dashboards
It's also possible to create additional dashboards for each work area. These dashboards can also be customized with widgets to show the relevant information. Both the default dashboards and the additional dashboards can be reset to the default layout.
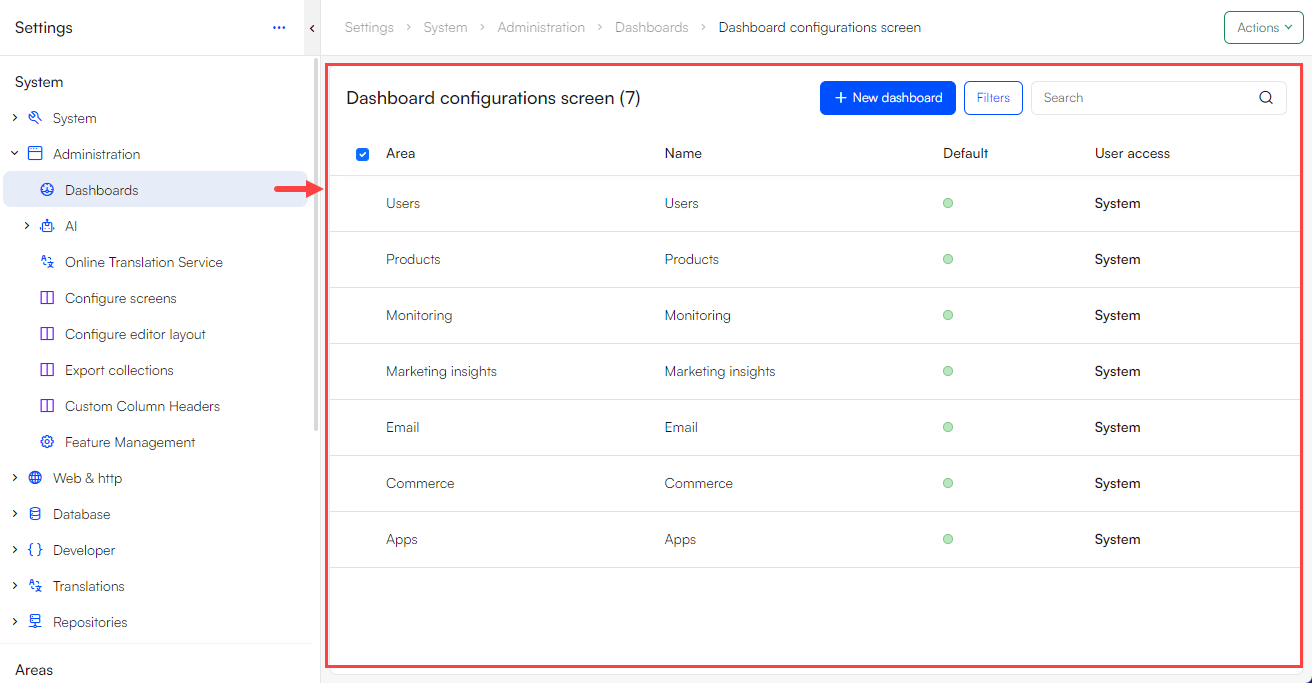
To create an additional dashboard under an area:
- Go to Settings > Administration > Dashboards and click on what area type you want to add a dashboard to
- Click New dashboard
- Give the dashboard a title, and if needed set as default and assign it to a user or user group
- Click Create, once created, the additional dashboard can be found under the selected area type
Widgets
A widget is a small, interactive tool displayed on a dashboard that provides specific information or functionality. Think of it as a mini-app within a larger system, designed to give you a quick insight or perform a specific task without navigating away from the main view.
There are broadly three types of dashboard widgets.
- Counters, which count something – naturally.
- Lists, which can render key data in list format
- Graphs, that render data in a bar, line, or pie format.
There are also Query widgets, which can function as all of the above. These widgets will require data from a configurable index query that you can make to suit your requirement.
Modify widgets
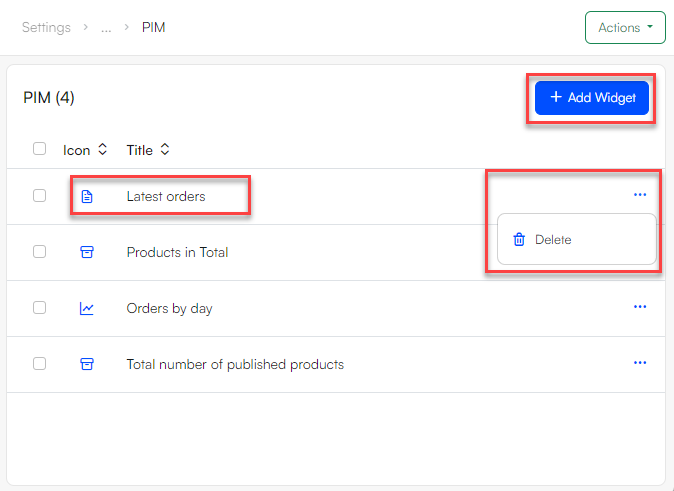
For each dashboard, you have the flexibility to add, edit, or remove widgets:
Enter the Dashboard you wish to change
From here you can choose to add, edit, or remove a widget
- To add a widget, click Add Widget
- To remove a widget, click the three dots and click Delete
- To edit a widget, click the widget you wish to edit
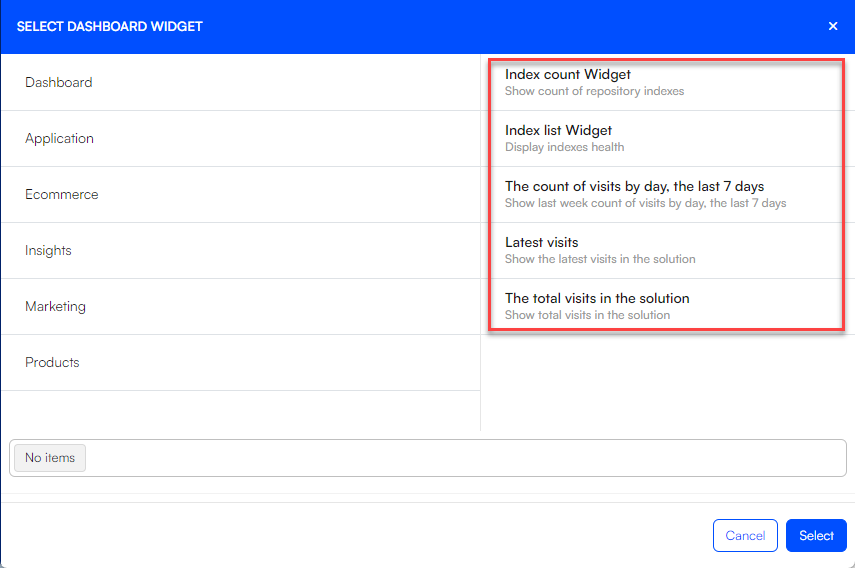
When adding a widget, navigate through what area type of widget is preferred and select one or multiple
Overview of preconfigured widgets
DynamicWeb ships with a number of preconfigured widgets for each type of dashboard, which can be added and used as is or with minimal configuration. Below are the lists of these widgets sorted by the area type.
The preconfigured widgets can be customized to a certain extent e.g. through color parameters on certain widgets that will change color based on various thresholds. This makes it possible to provide instant feedback on the state of KPI’s such as daily turnover, weekly visitors, etc.
If the default widgets are inadequate in some way, it’s easy to create custom widgets. You can open an existing widget and reconfigure it, or you can create new widgets from scratch. All widgets have a columns setting which can be used to change the width of the widget. The dashboard is 12 columns wide.
Dashboard widgets
| Name | Type | Description | Comments |
|---|---|---|---|
| Index count widget | Count | Show a count of indexed with a particular status | Can be limited to a single repository. Can count indexes builds with status Error, Success or Warning. |
| Index list widget | List | Lists indexes with their current status | Can be configured to include only indexes from a particular repository, and with a certain status (Error, Success, Warning) |
| The count of visits by day, the last 7 days | Graph | Show last week count of visits by day, the last 7 days | |
| Latest visits | Count | Show the most recent visits to the frontend | |
| The total visits in the solution | Count | Show a count of the total number of visits to the solution |
Application widgets
| Name | Type | Description | Comments |
|---|---|---|---|
| Query counter widget | Count | Perform a scalar operation with result of a repository query | Can be configurated as showing average, count or sum |
| Query facet widget | Graph | Display facets from a repository query | |
| Query grid widget | List | Display rows from a repository query | |
| Query list widget | List | Display pairs of title - hint fields from a repository query |
Ecommerce widgets
| Name | Type | Description | Comments |
|---|---|---|---|
| Average order value per day | Graph | Show the average order value per day in EUR | |
| Carts to orders conversion rate per day | Graph | Show the carts to orders conversion rate per day | |
| Completed orders on channels | Graph | Show the completed orders on channels | |
| Completed orders per day | Graph | Show the completed orders per day | |
| Orders by day | Graph | Show the latest created orders in the solution per day of week | |
| Summed orders | Count | Show sum of all orders in the solution | |
| The total orders in the solution | Count | Show total orders in the solution | |
| Latest created orders | List | Show the latest created orders in the solution | |
| Total revenue on channels | Graph | ||
| Total revenue per day | Graph | Show total revenue per day |
Insights widgets
| Name | Type | Description | Comments |
|---|---|---|---|
| Customer report | Graph | Customer Report showing new and repeating customer over time | Can be configured to compare to the previous period or year |
| Traffic report | Graph | Website traffic analytics report | Can be configured to compare to the previous period or year |
| Events - graph | Graph | Show a graph of specific type of events by day in the solution | |
| Events - count | Count | Show total events of a specific type in the solution | |
| Events - list | List | Show total events of a specific type in the solution | Use parameters to control the event level, category, and time period covered |
| SQL query counter | Count | SQL Query Counter | |
| Scheduled tasks - count | Count | Show count of scheduled tasks in the solution | |
| Scheduled tasks - list | List | Show list of scheduled tasks in the solution | Can be configured to include only tasks of a certain type, tasks which failed, etc. |
| SQL query table | Graph | SQL Query Table |
Marketing widgets
| Name | Type | Description | Comments |
|---|---|---|---|
| Total number of users with email allowed in the solution | Count | Show total number of users with email allowed in the solution |
Products widgets
| Name | Type | Description | Comments |
|---|---|---|---|
| Total number of active products | Count | Show all active products in the solution | |
| Last changed products | List | Show a list of the last changed products | |
| Newly created products | List | Show a list of the newly created products | |
| Number of sales | Graph | Show information about how many quantities of this specific product have been sold in the period | |
| Number of visits | Graph | Show information about how many times this specific product has been visited | |
| Product channels | Graph | Show all the Channels/Shops a specific product | |
| Products in total | Count | Show Total products in the solution | |
| Product latest changes | Graph | Show the latest changes (TOP 10), that has been made on the specific product | |
| Product number of changes | Count | Show the total number of changes, that has been made on the specific product | |
| Product referrers | Graph | Show information about how many visits have been done from specific referrers of this specific product in the period | |
| Total number of published products | Count | Show all published products in the solution | |
| Related products | List | Show a list of the related products a specific product | |
| Relations to current product | List | Show a list of the products which have a relation to this specific product | |
| Total number of unpublished products | Count | Show all unpublished products in the solution |