Insights
Monitoring, analytics and more
The Insights area is where important data is organized to show system events, data health, analytics and much more. The Insights area makes it possible to have an overview of your application.
The area consists of:
- The tree, which is used to select the tool you want to work with
- The workspace, which is where you work with your chosen tool
The tree contains three main categories:
- Dashboard – provides a visual overview of events such as errors, warnings and failed tasks
- Monitoring – contains the tools; Reports, Event viewer, Health, Notifications and Logs
- Analytics – contains analytical data related to your application
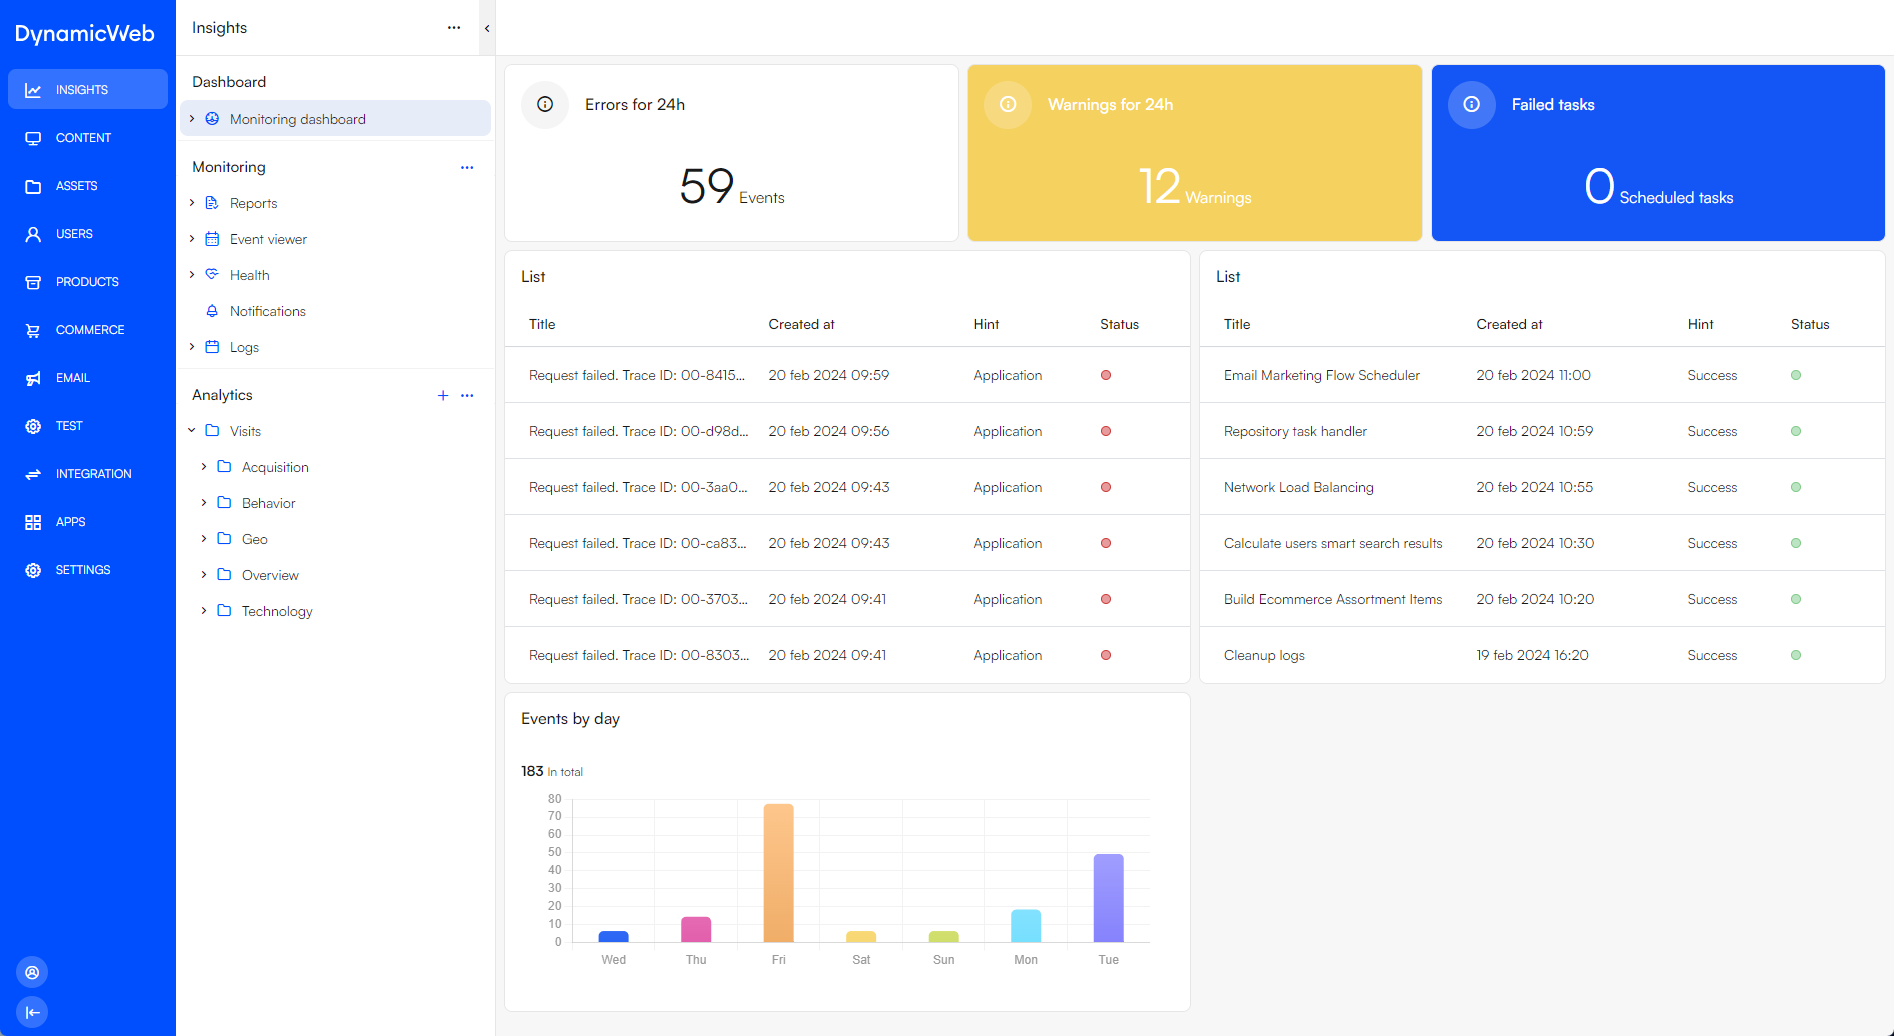
Monitoring dashboard
The Monitoring dashboard is the default workspace when opening the Insights area. The preconfigured dashboard contains widgets that show the state of various important system events:
- Number of errors the last 24 hours
- Number of warnings the last 24 hours
- Number of failed tasks
- A list of recent errors
- A list of recent scheduled tasks
- A graph of the amount of daily events the last week
Like all dashboards, you can add and remove widgets as you please in the Settings area.